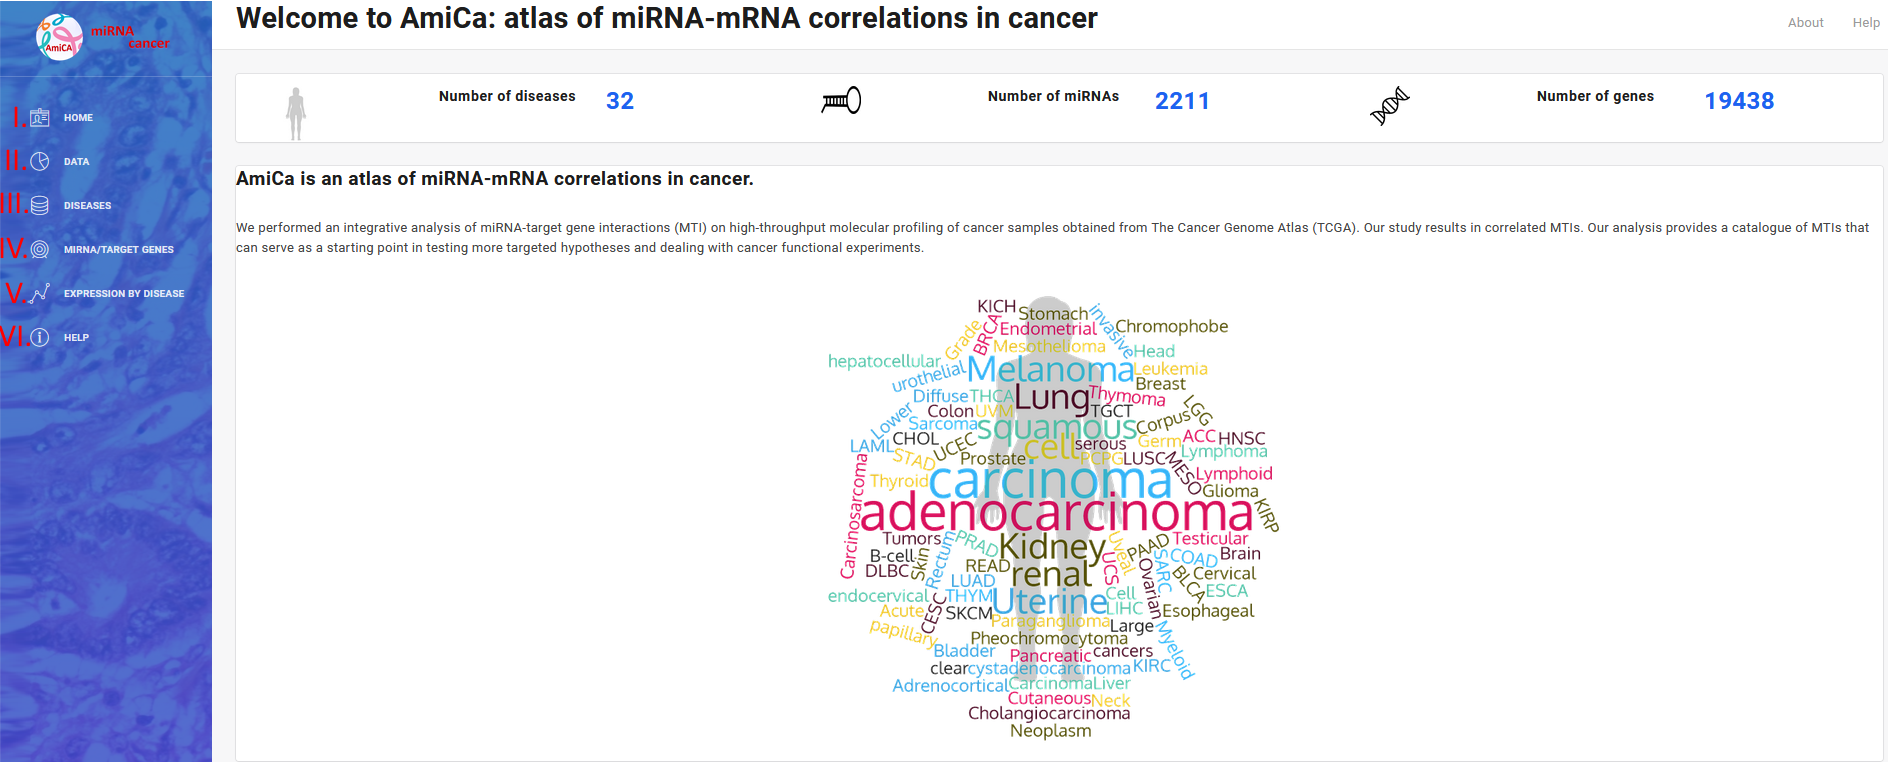
AmiCa: atlas of miRNA-mRNA correlations in cancer: a freely available web platform for studying the expression of miRNAs and their target genes in 32 cancers. Here is a step-by-step tutorial about the miRNA-mRNA expression atlas. Users can study the expression of miRNA and mRNA in different cancer samples through web forms in many ways. Currently, users can search according to diseases (III.) and/or miRNA/target gene name (IV.). miRNA and gene expression can be compared between cancers via graphical representation (V.). AmiCa can be used as a starting point in testing more targeted hypotheses and designing experiments using optimal miRNA and/or gene for further studies.
II. Data
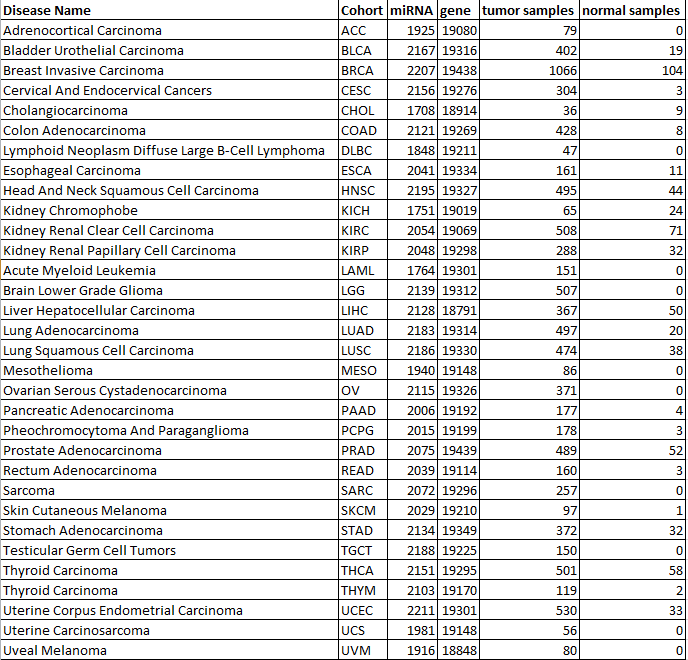
AmiCa was constructed from The Cancer Genome Atlas (TCGA) and from the miRTarBase databases. Cancer samples were obtained from TCGA projects. Table 1 shows the number of miRNAs, genes, tumor and normal samples for each of studied cancers.
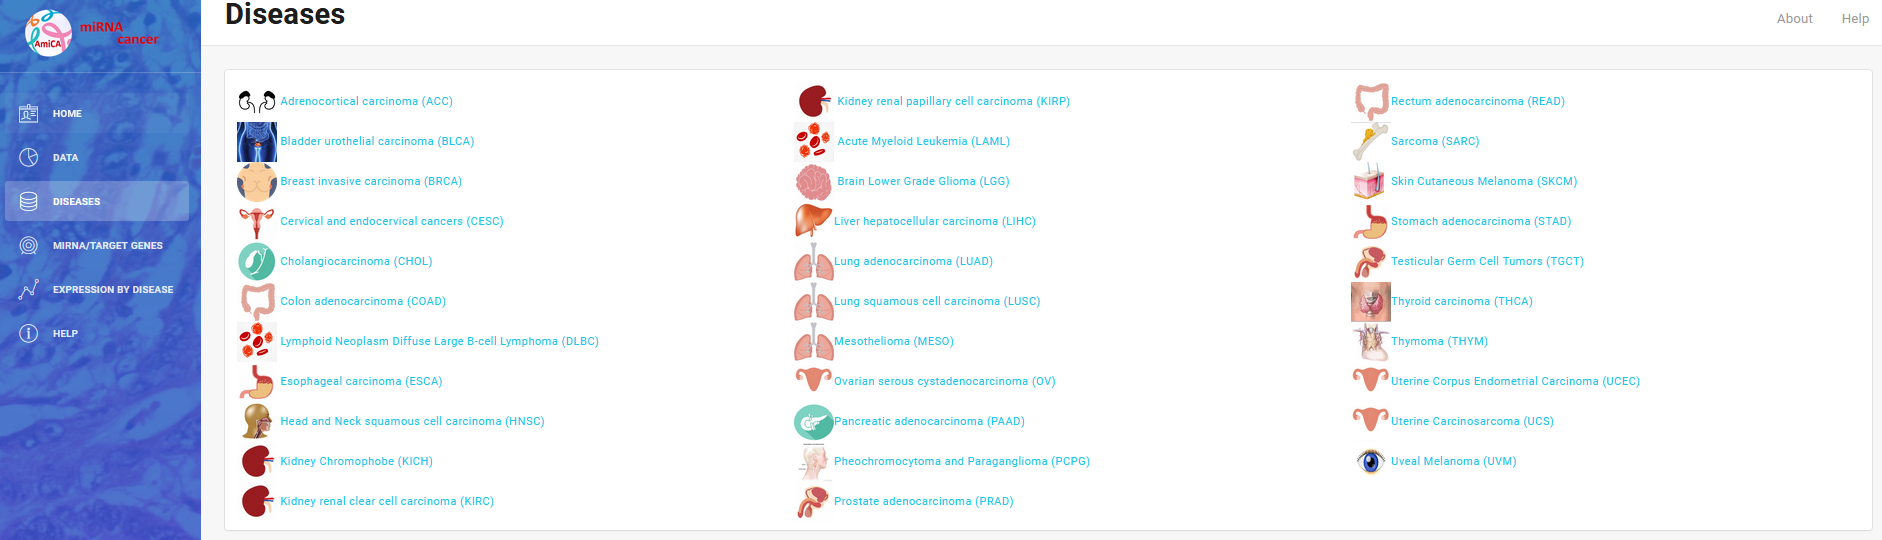
III. Diseases
Using this platform, we can study expression of miRNAs and their target genes in 32 cancers.
First of all choose one cancer name…
... We chose “Breast Invasive Carcinoma (BRCA)”:
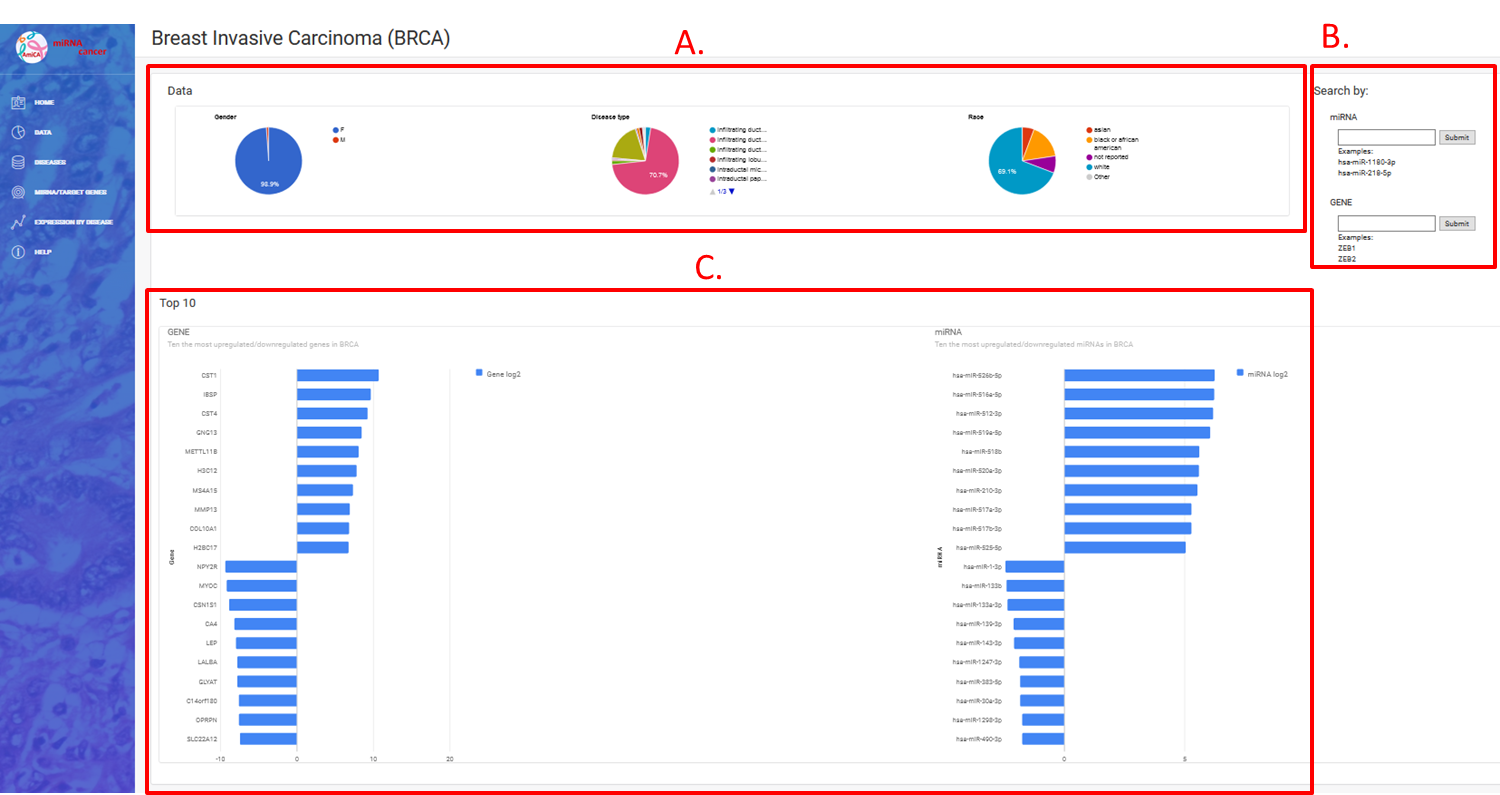
On this Breast Invasive Carcinoma (BRCA) “Welcome” site, we can find three divisions:
- A. Statistics by gender, type of disease and race,
- B. Web forms for searching by miRNA and/or gene name,
- C. Ten the most up-/downregulated miRNAs/genes in this cancer
Use case
Due to their known involvement in Breast Cancer, we used miRNA hsa-miR-335-5p and its target gene EPHA4 for the use case:
Search by miRNA or gene name (B.):
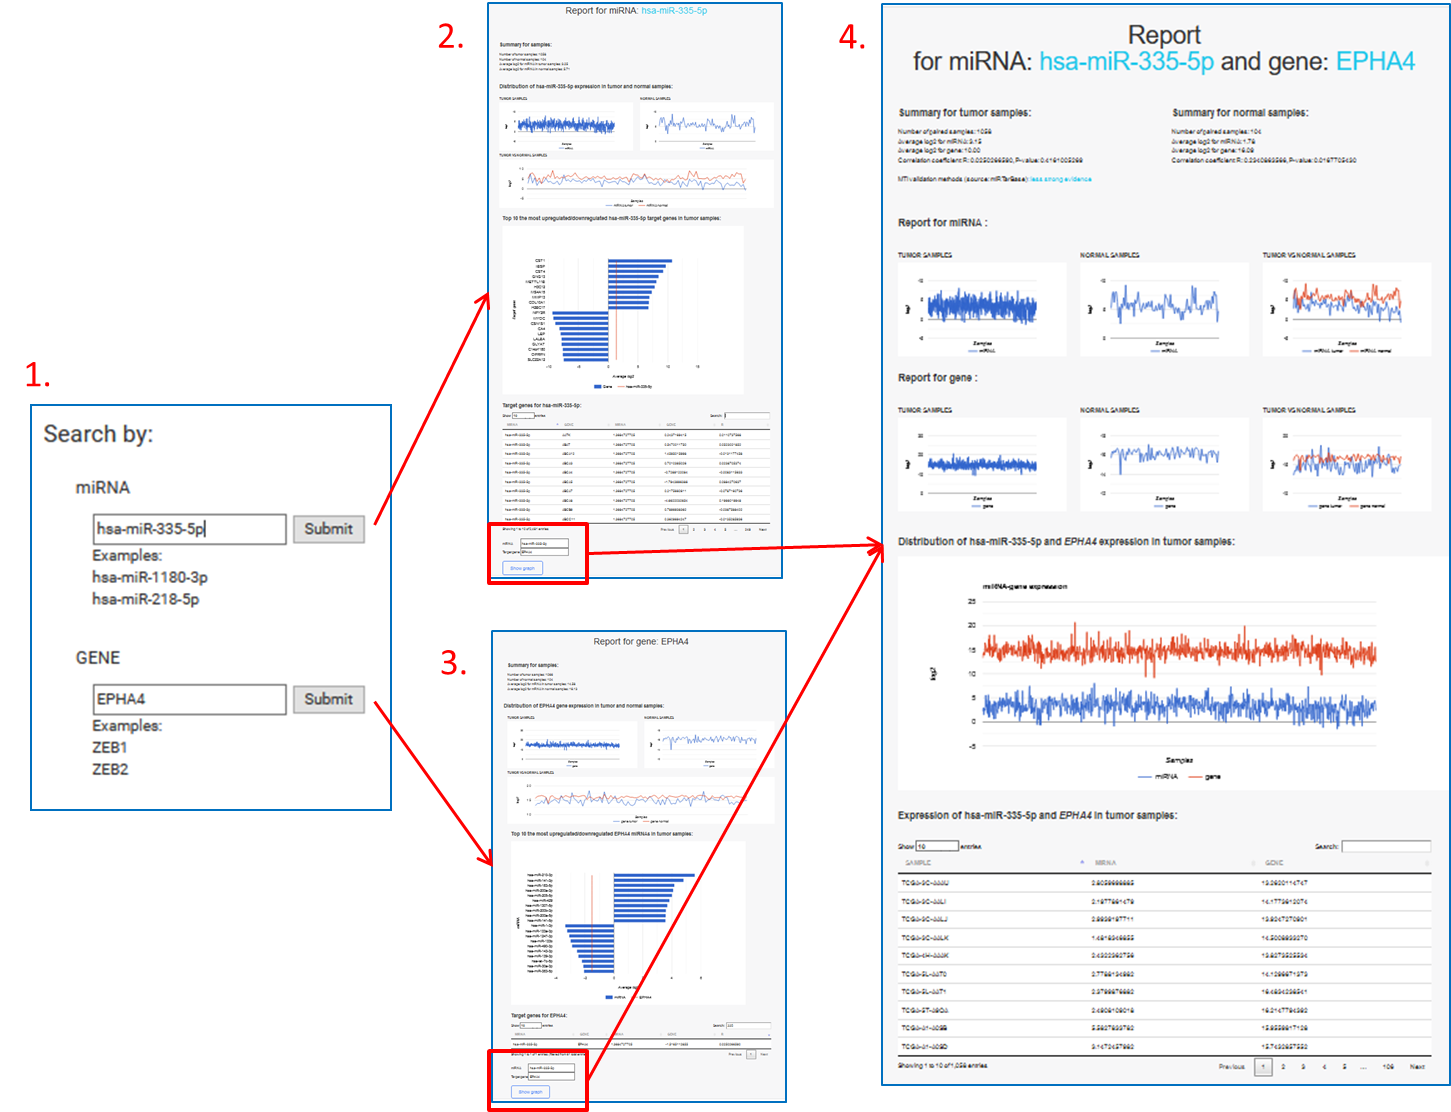
Insert a miRNA and/or gene name (1.).
Report for miRNA (2.) and/or gene (3.) will open in new tab. It contains:
- Summary,
- Distribution of miRNA/gene expression in tumor and normal samples,
- Top 10 the most upregulated/downregulated miRNAs/target genes in tumor samples
- List of target genes for selected miRNA or list of miRNAs for selected target gene
On list of target genes for selected miRNA or list of miRNAs for selected target gene, click on row and submit a selection with "Show graph" button.
Report (miRNA/gene) will open in new tab (4.):
It contains:
- Summary for tumor samples,
- Summary for normal samples,
- Report for miRNA,
- Report for gene,
- Distribution of miRNA and gene expression in tumor samples,
- A table of differential expression of selected miRNA and gene in each tumor tissue sample
IV. miRNA-target genes: expression by diseases
Insert a miRNA and/or gene name (for example gene ZEB1)...
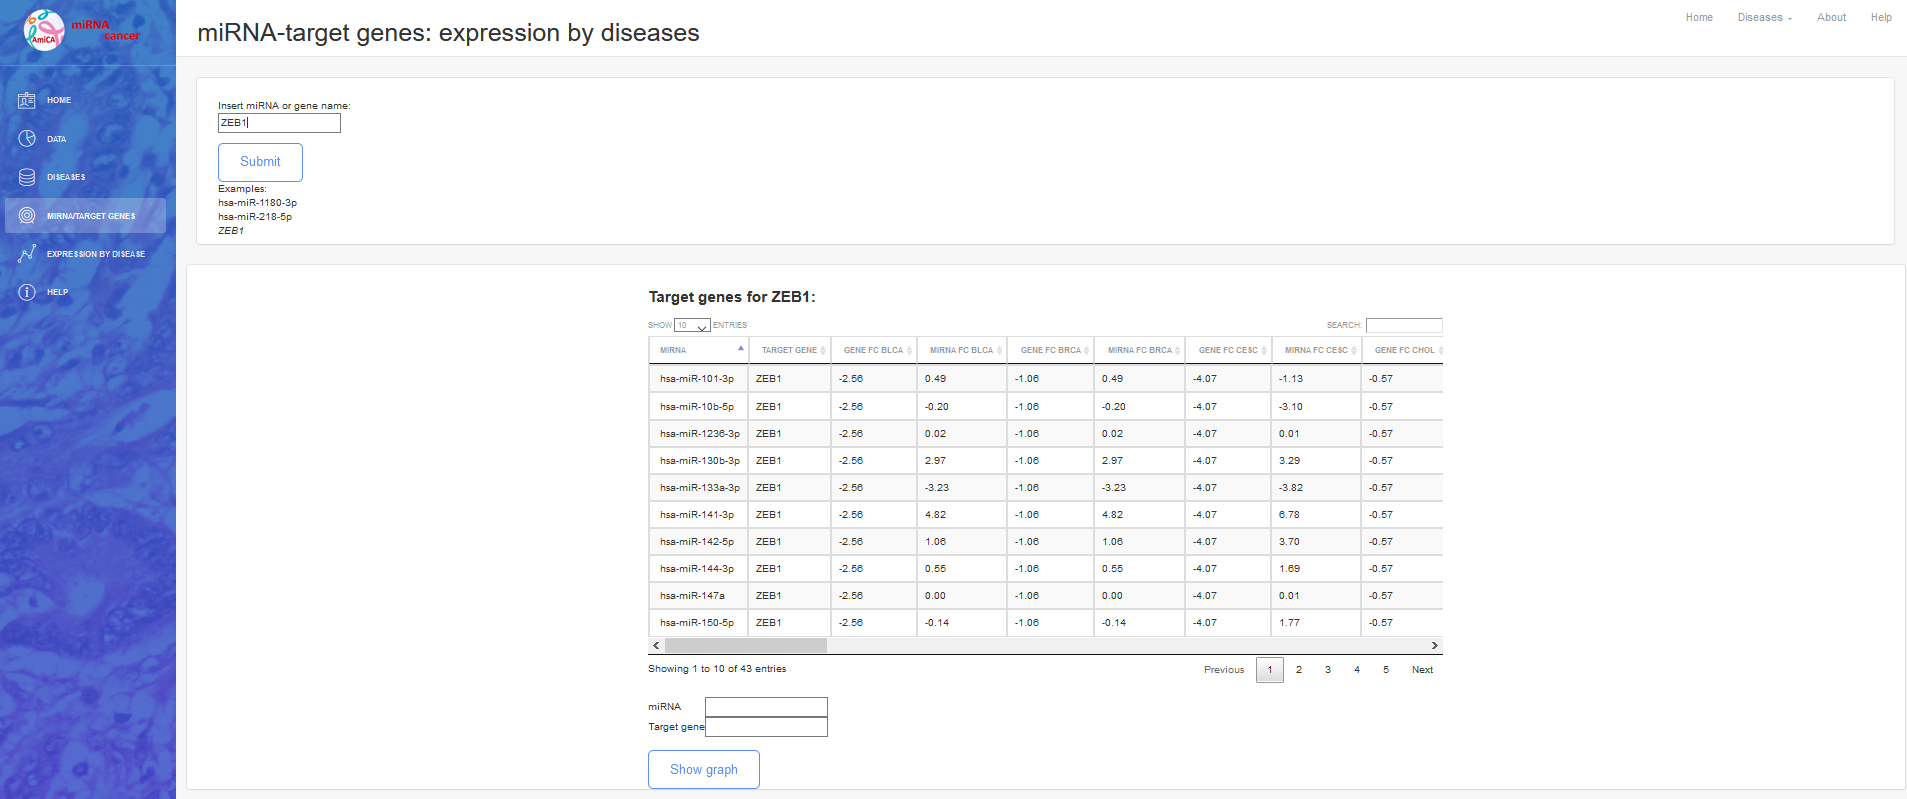
Searching result contains a table with miRNA and their target genes as well as gene and miRNA “Fold Change” values for each cancer. We can search (a specific) miRNA (for example hsa-miR-200a-3p), typing in “search” window.
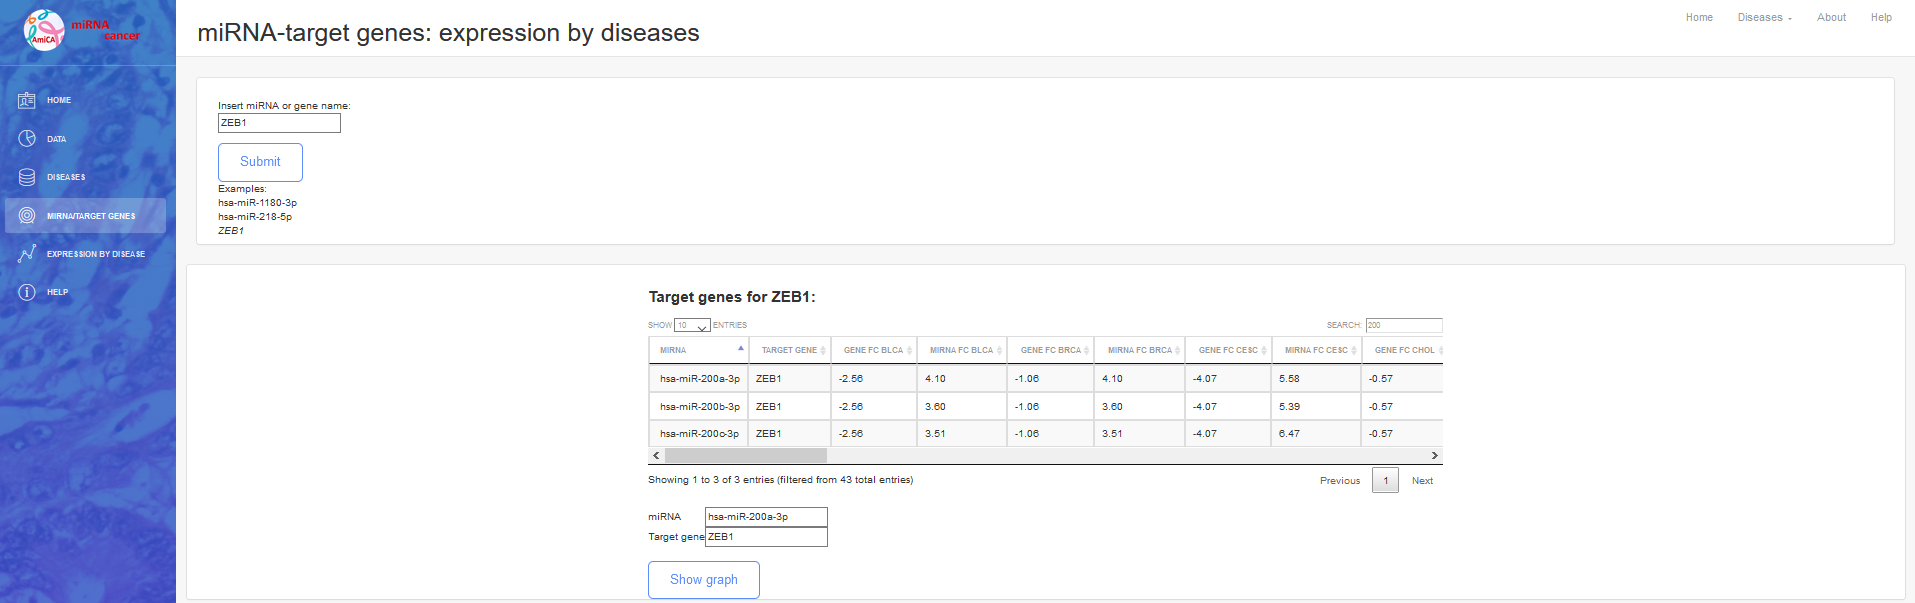
Click on row and submit a selection with "Show graph" button for graphical view of miRNA and gene expression in cancer tissue.
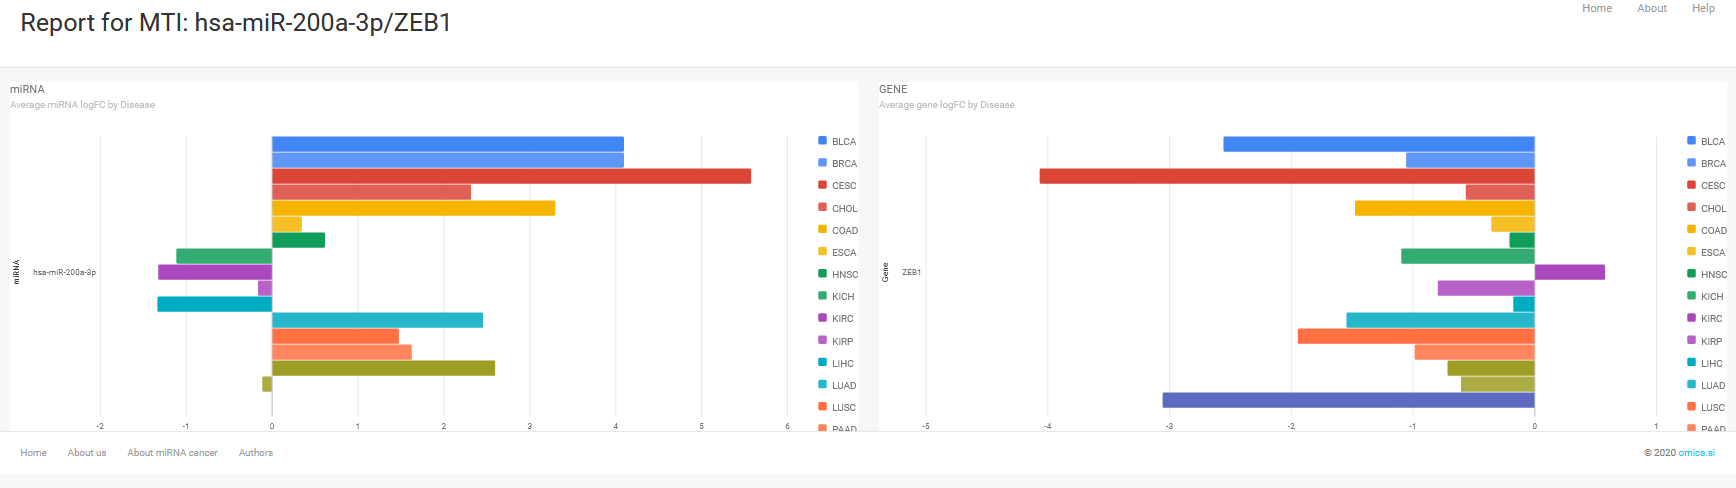
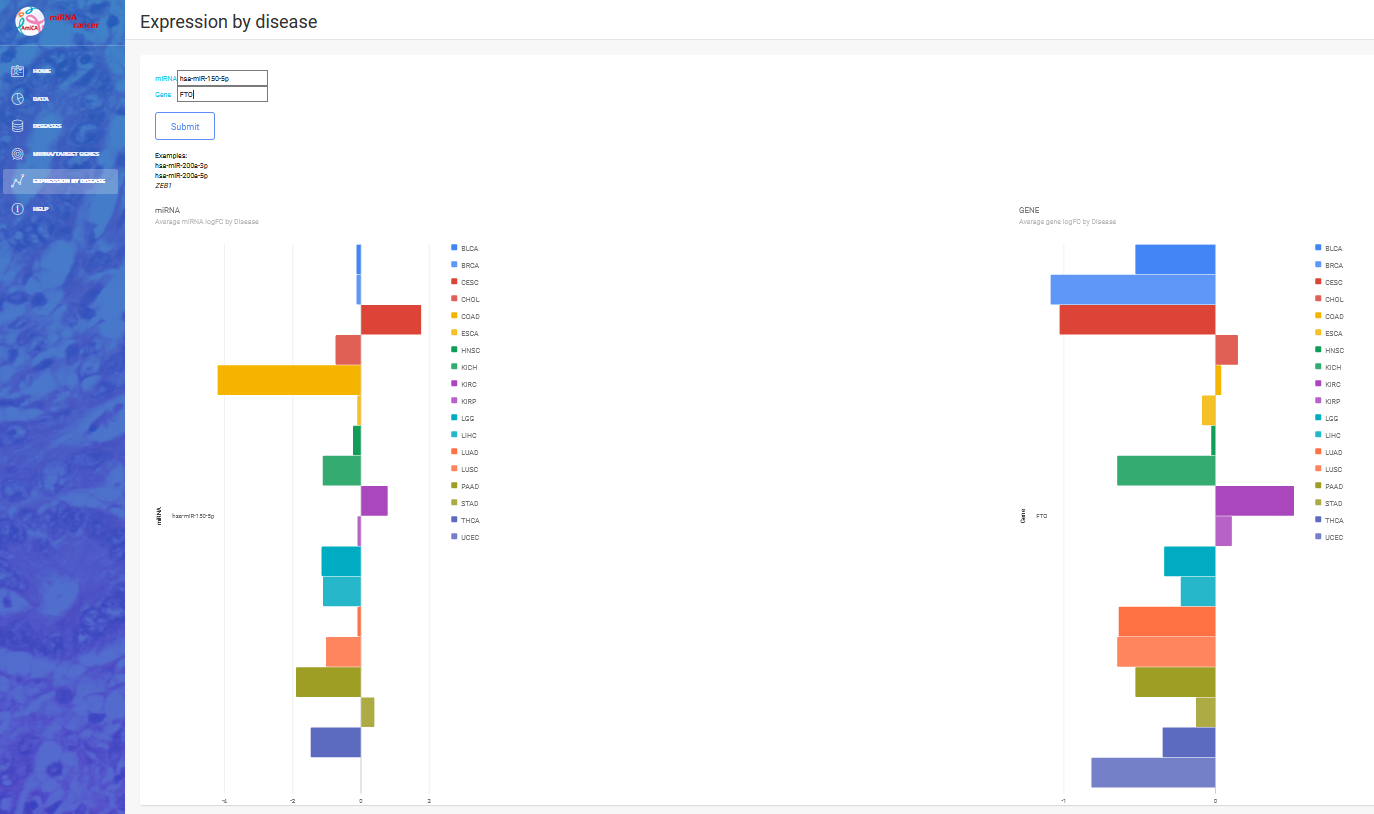
V. Expression by diseases
Using tab “Expression by disease”, we can graphical shown expression of any miRNA and/or gene.